Free Medicaid impact dashboard
See what H.R. 1 does to your state. Free.
Open the real Nexus Policy Dashboard for your state — state funds, coverage loss, hospital margins and the providers at risk — with a free account.
Free · No credit card · Four quick steps
Sign up to see your state. Book a demo
Try it — drag a lever
These are made-up numbers. Your state's real ones are a free account away.
See my stateThe free dashboard
Your state's dashboard, open in a few minutes.
The same dashboard our clients use, with the scenario controls locked. You see the headline impacts and how the model is laid out before you talk to anyone.
Create a free account
Your name, your organization and what brought you here. Confirm your email and you're in.
Open your state
If we have modeled your state, you start there. If not yet, you can explore a state we have and book a demo to talk through yours.
Explore the impact
The headline impact figures are filled in. Every tab, county, plan and hospital is listed, so you can see what the full model covers.
| What you can do | Free account | Full access |
|---|---|---|
| Your state's headline impacts — state funds, coverage, hospital margins | Included | Included |
| Every tab, with county, plan and hospital names | Visible; detailed figures greyed | Every figure |
| Change scenarios — coverage, rates, benefits, H.R. 1 provisions | See the options | Pull any lever |
| Printable reports for boards, members and testimony | Not included | Included |
| Calibrated to your organization's own data | Not included | With an engagement |
Step by step
Walk through the dashboard before you sign up.
The free dashboard opens with a short tour. Here it is, step by step, on a sample state.
Step 1 of 5
Open your state
It is the same dashboard our clients use, set to one scenario: H.R. 1 as enacted, for the coming budget period.
Step 2 of 5
Read the headline impact
State funds, coverage loss, hospital margins and health-plan finances are filled in for your state.
Step 3 of 5
Look through every tab
Every tab is open, with each county, plan and hospital listed, so you can see what the full model covers. The detailed figures are greyed in the free view.
Step 4 of 5
See the filters
In the free view the filters are preset. Clients choose a county, region or district, other budget periods, other projection sources and the policy levers.
Step 5 of 5
Go further with us
Book a demo and we walk you through every figure and filter for your state. With an engagement, we calibrate the model to your organization, run your scenarios and deliver the reports. The dashboard is a managed service: our team runs it with you.
The old way
A committee asks for a fiscal impact by Thursday. The actuarial work-up lands in three weeks. Improvise the rest.
The decision happens before the numbers arrive.
Nexus closes that gap. Pull a lever — coverage, rates, benefits, an H.R. 1 provision — and see the quantified impact in minutes, with every assumption visible so legislators, hospitals, MCOs, and counties interrogate one model instead of competing spreadsheets.
Who it's for
Built for the people answering “What does this do to us?”
-
Where we start
Hospital Associations
Built for everything from advocacy to committee testimony — exactly what a coverage loss, rate cut, or H.R. 1 provision does to your hospitals, by region, quantified and defensible.
See your hospitals' exposure -
Health Plan & MCO Associations
MLR, risk-based capital, and revenue exposure by plan under any coverage or rate scenario — the financial picture your members need before the next rate cycle.
See your plans' exposure -
State Medicaid Agencies
Build budget options and answer amendments in real time during session — with the trade-offs already mapped, not improvised at the witness table.
See your state's budget impact -
County Associations & Regional Collaboratives
What a coverage loss or H.R. 1 provision means county by county: uninsured residents and local hospitals, in figures your commissioners and regional partners can act on.
See your counties' exposure -
Anyone Medicaid Touches
Legislators and their staff, advocates, foundations, provider groups and consultants. If a Medicaid change lands on your work, the free account shows what it does in your state.
Start with a free account
Why it works
Fast, transparent, and specific to your state.
Speed
Respond to a legislative amendment in 30 seconds — not three weeks waiting on the next actuarial cycle.
Transparency
Every formula is visible. A common framework legislators, hospitals, MCOs, and counties can all interrogate.
Specificity
Built on your state's own rate models, federal match, enrollment, and hospital and health-plan financials — not national benchmarks.
Case study
Why we built it: a hospital association’s members needed their numbers.
The Policy Dashboard started with a statewide hospital association that had to tell its members what H.R. 1 would mean for each of them, while the details were still arriving. We have since built a dashboard for every state.
The challenge
Changes to Medicaid coverage and financing were landing on different timelines, and the figures that mattered were spread across federal and state agency documents. Members, the board and legislators were all asking the same question: What does this do to us?
What we built
- A state dashboard of coverage and financing changes, year by year
- Every figure traced to the agency source it came from
- A hospital-by-hospital view of what is at risk
- Scenarios the association can adjust and walk its members through
What it gives them
One set of numbers for member, board and legislative conversations, with the sources in view, so the discussion is about what to do rather than whose figure is right.
Shared with the organization’s details and figures removed.
From a first look to a full model
Start free. Go further when you need to.
-
Start here · Free
Free account
Your state's headline impacts and the full layout of the dashboard. No time limit.
Create a free account -
See the whole thing
Book a demo
A short call where we walk you through every figure, filter and policy lever for your state. Book it from inside your free dashboard, or here.
Book a 30-minute demo -
For your organization
Engagement
We calibrate the model to your organization, run your scenarios and deliver reports you can take to a board or a committee.
Book a 30-minute demo
What an engagement looks like, in four steps.
Fine-tune your model
We calibrate the model to your state’s rates, providers & budget
Define scenarios
The policy changes & H.R. 1 provisions
Nexus models & delivers
The analytics engine runs — detailed reports + reference papers
You put it to work
Advocacy, board & member communications
Under the hood
How Nexus models and delivers.
Every scenario runs through the Nexus analytics engine — proprietary algorithms, calibrated to your state's data, with every assumption documented and traceable to its source.
Inputs
- Policy levers & H.R. 1 provisions
- State rate models & FMAPs
- Enrollment & coverage projections
- Hospital & CCO/MCO financials
Nexus
Analytics Engine
Coverage, cost, and financial-impact algorithms — calibrated to your state and auditable end to end.
Outputs
- State budget & federal-match impact
- Coverage loss & uninsured
- Hospital margins & uncompensated care
- MCO MLR, RBC & at-risk providers
Algorithms and data integration are proprietary; methodology is documented for clients under engagement.
Who built it
People who've run Medicaid from the inside.
-

Mike Bonetto, PhD
Policy & strategy
Former Oregon Governor's Chief of Staff and Senior Health Policy Advisor who helped lead the state's Medicaid transformation. 25+ years in health policy and strategy.
-

J.R. Long
Operations & partnerships
25+ years of senior executive leadership across HCSC, Centene, Conexia, and Ciox — scaling health-plan operations and solutions for providers and payers.
-

Nate Bonetto
Data & modeling
Health economist focused on Medicaid financing, provider payment, and health-system financial performance — translating complex data into decisions.
-
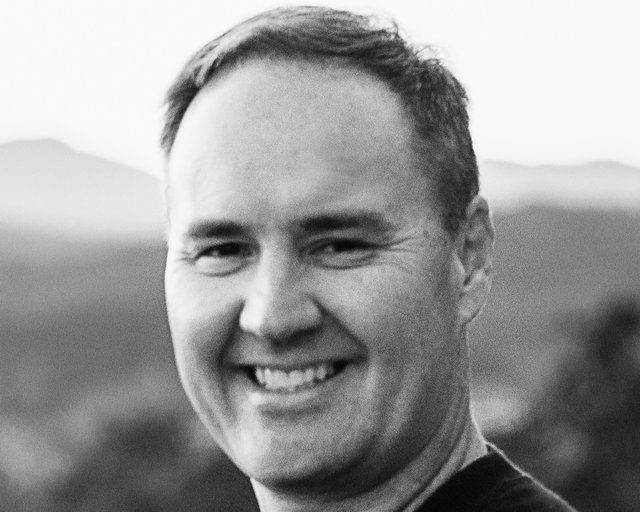
Doug Boysen
Advisor
Former President and CEO of Samaritan Health Services and past Board Chair of the Hospital Association of Oregon. 25+ years leading integrated delivery systems, health plans and hospital boards.
See where your state stands.
Create a free account, open your state and see the headline impact for yourself. When you want to run your own scenarios, we're a message away.
Questions? info@nexushealthstrategies.com
Figures on this page are illustrative only. Budget and scenario modeling for legislative and strategic planning — not a replacement for actuarial certification.